Building a trading dashboard from one prompt
Live Binance data, real testnet orders, and the prompt that gets your own Claude to build it.
 Savva Sicevs
Tradeboard is a trading dashboard I built with the free ssych components. It runs on live Binance data and places real orders on the Binance testnet. Then I wrote down how it's put together as one prompt, so a fresh Claude Code can build it from scratch.
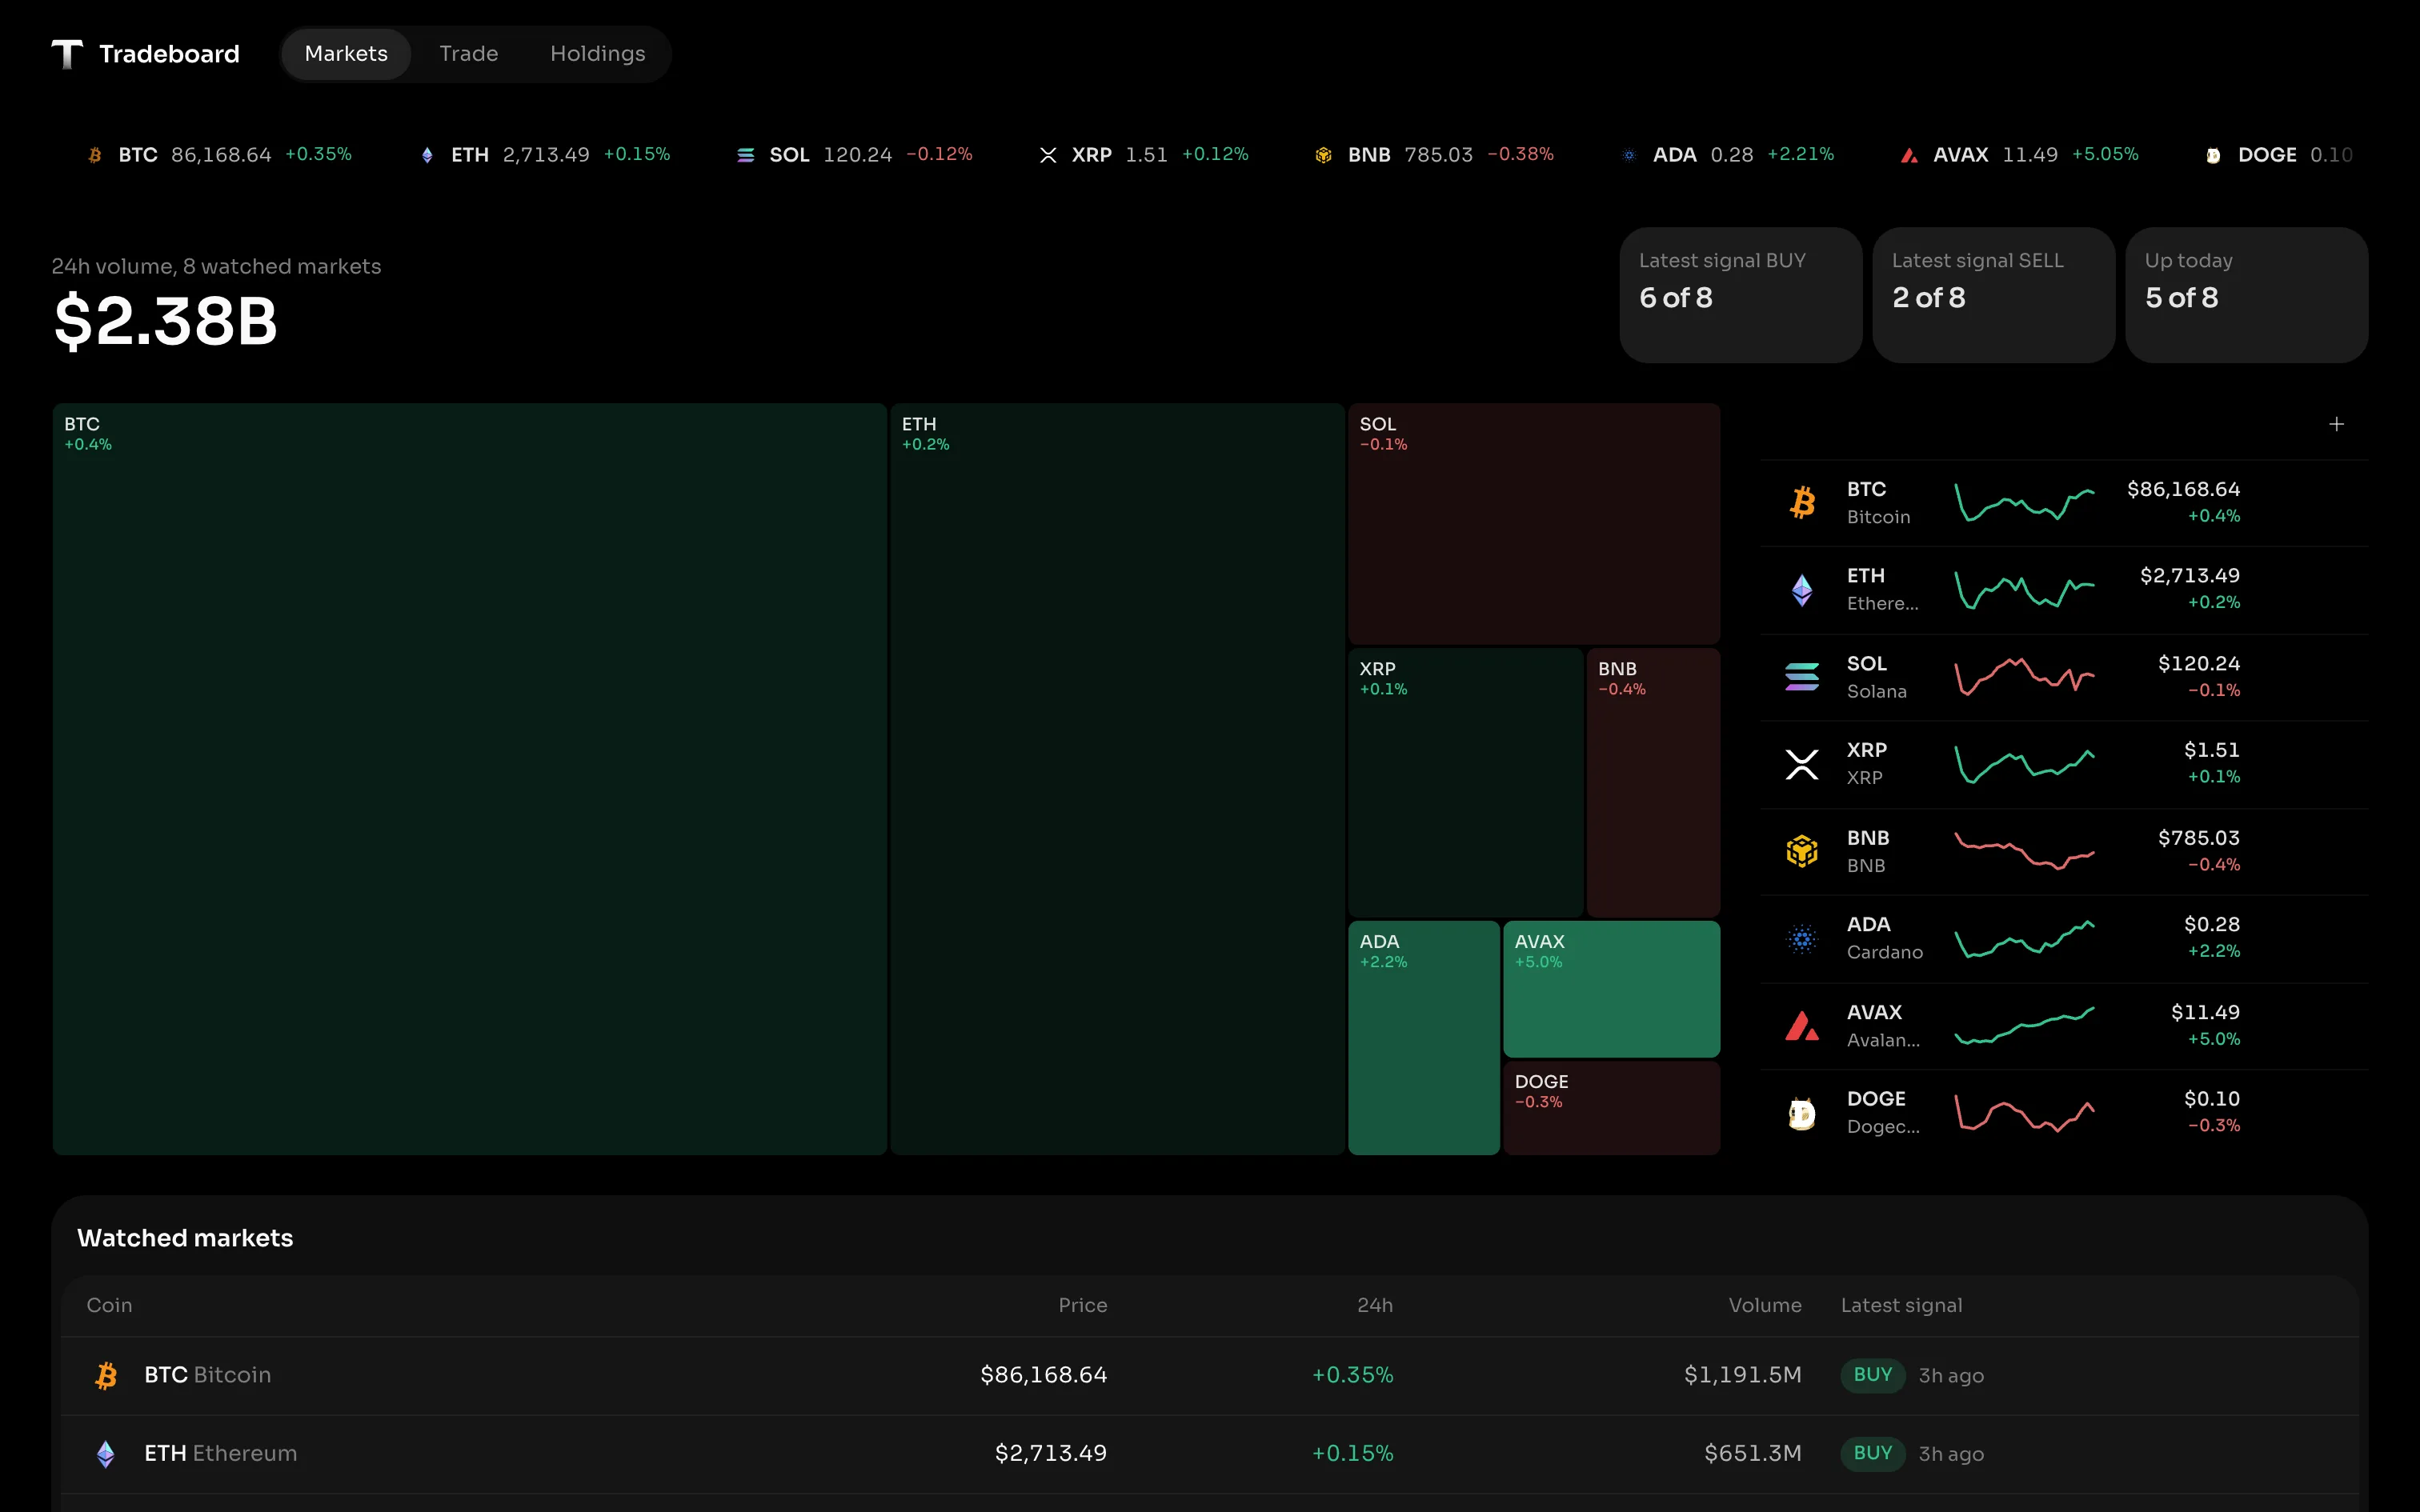
What Tradeboard does
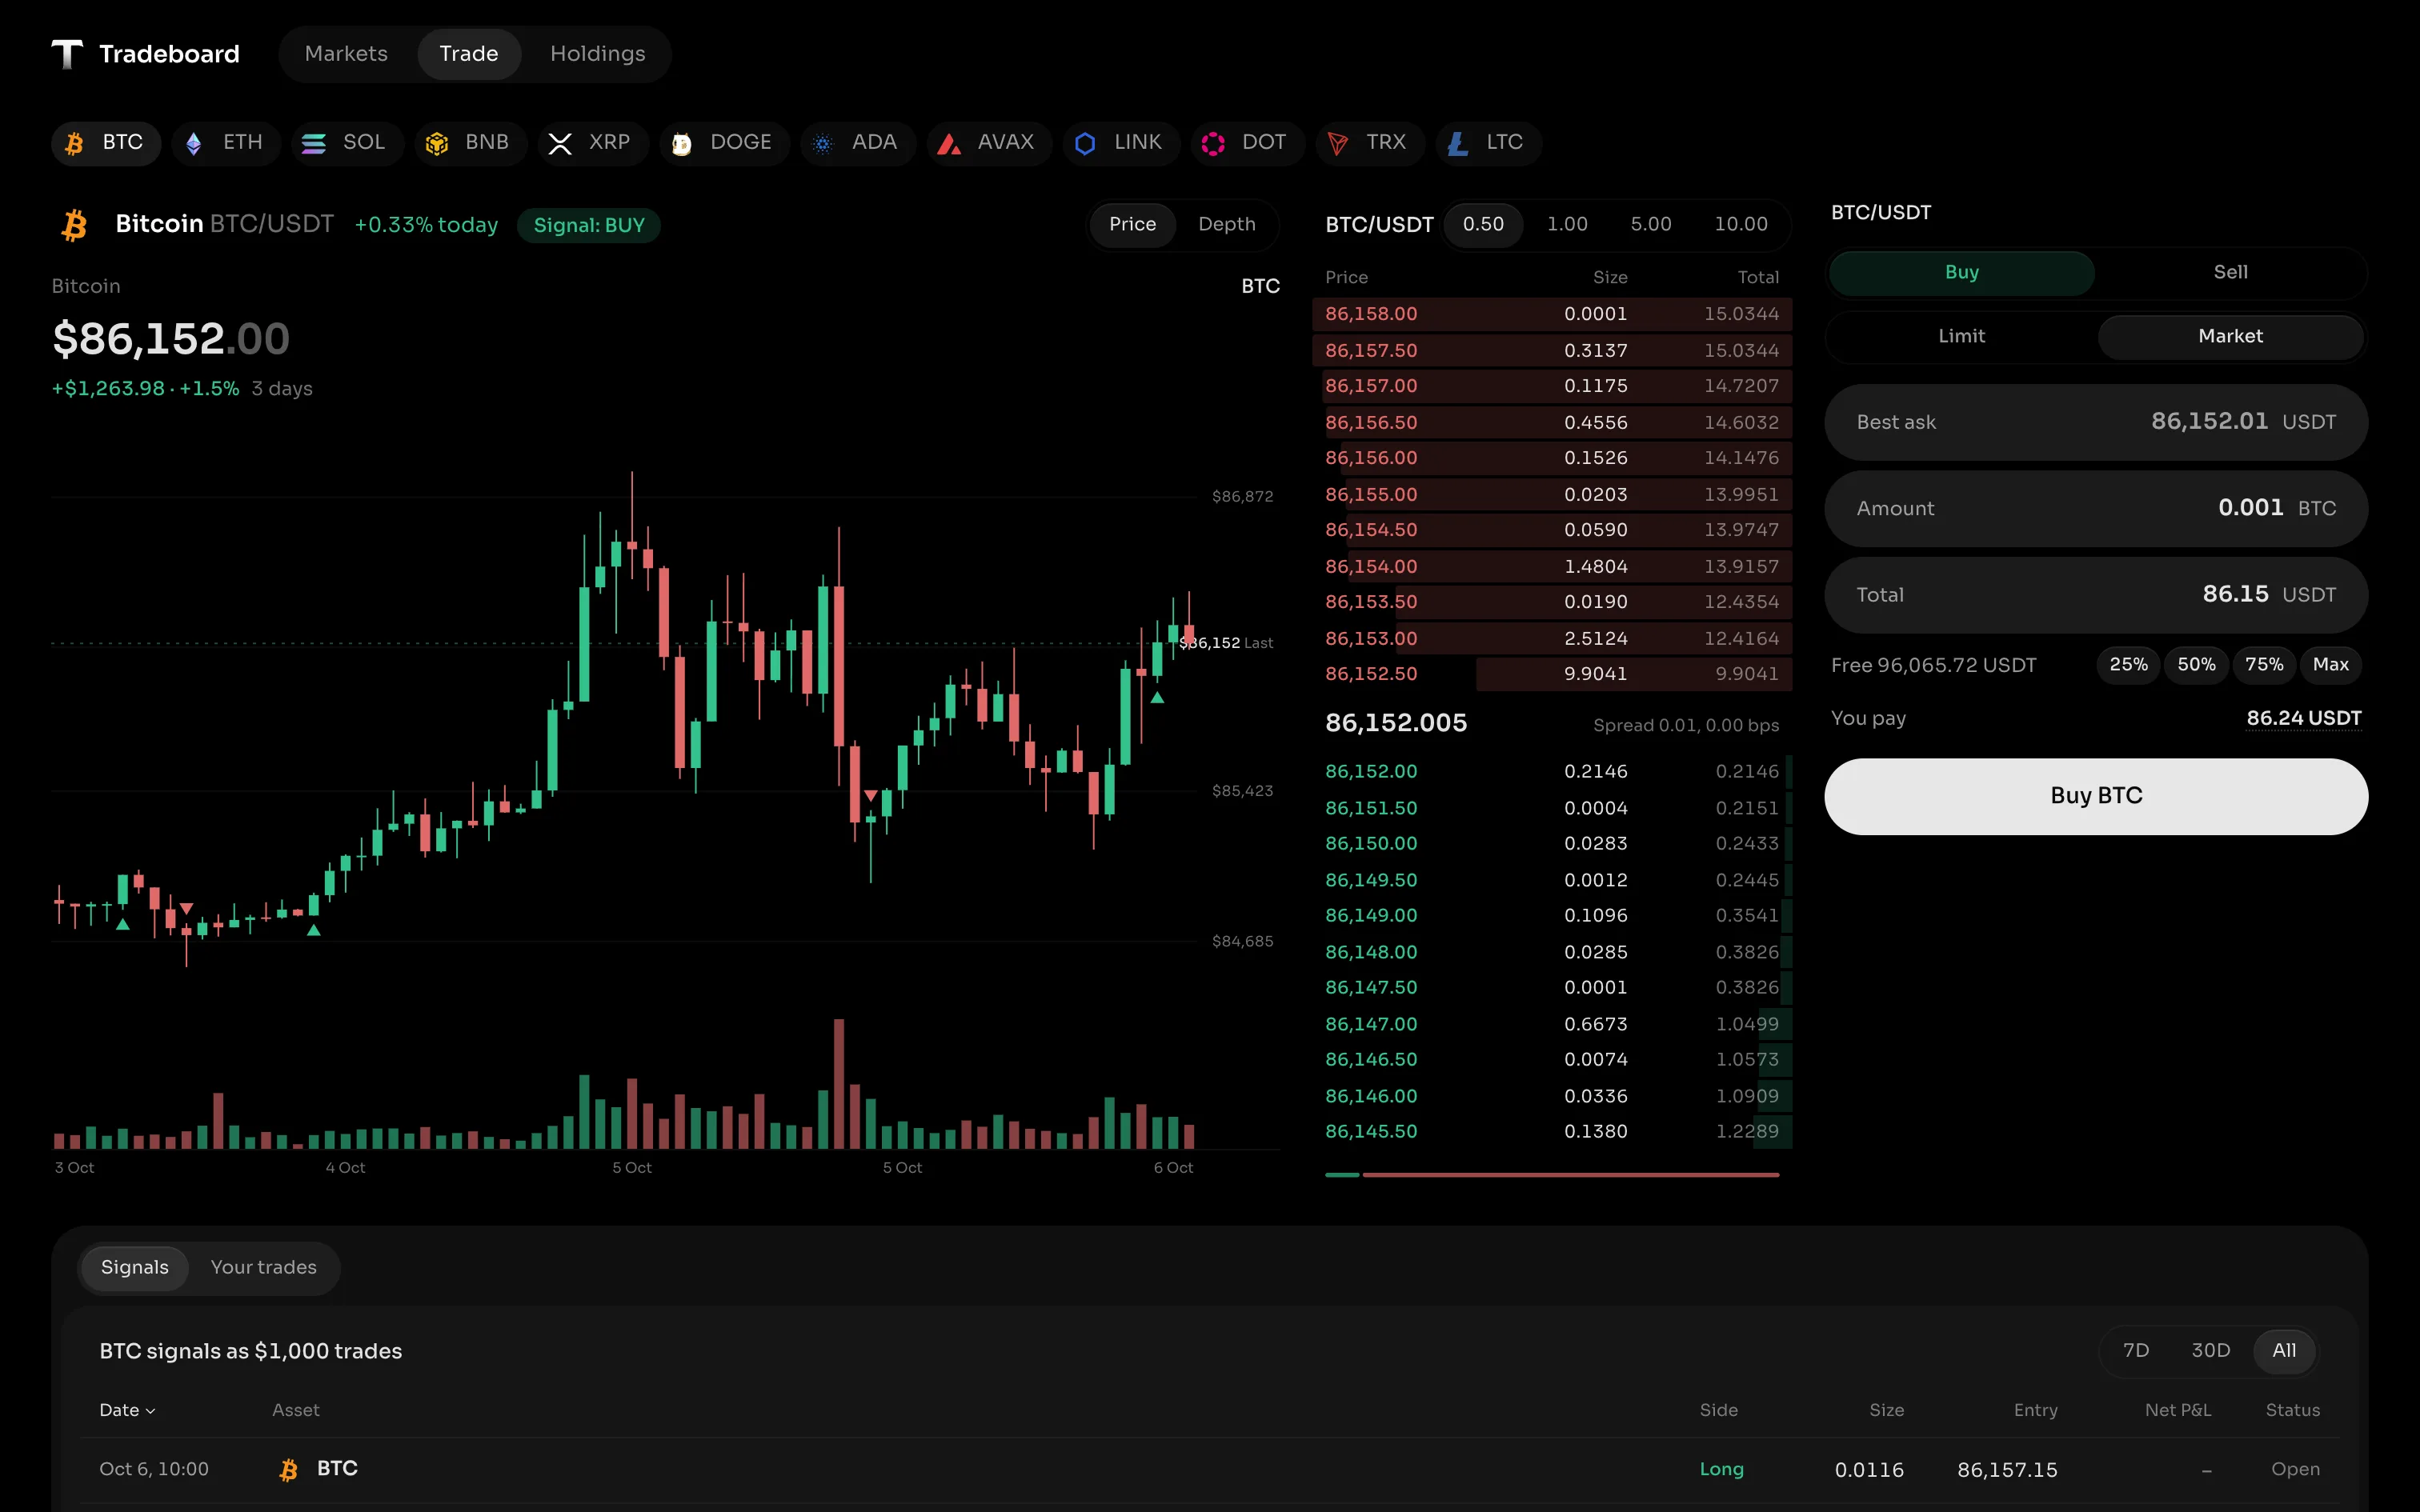
Prices, candles and order books come straight from Binance's public data. Each coin gets a buy or sell signal from a 9 and 21 hour EMA crossover. Orders go to the Binance Spot Testnet, Binance's own exchange running on fake money.
Markets puts the market map next to the coins you watch. Trade is the chart, the order book and an order ticket in one row, with every past signal as a $1,000 trade underneath. Holdings is the testnet account, a year of prices for the coins in it, and every order you placed.
 Open TradeboardPlace a test order on the Binance testnet. It's fake money.tradeboard.ssych.com
Same Claude, with and without the prompt
I gave Claude Code the data layer and asked for three pages: Markets, Trade and Holdings. No skills, no memory, no plugins. It built a good, working dashboard in 20 minutes.
Then I gave a fresh Claude the same data and the prompt. It installed the components and built the screens below. I ran that twice, it took 15 minutes and then 34, and both builds passed.
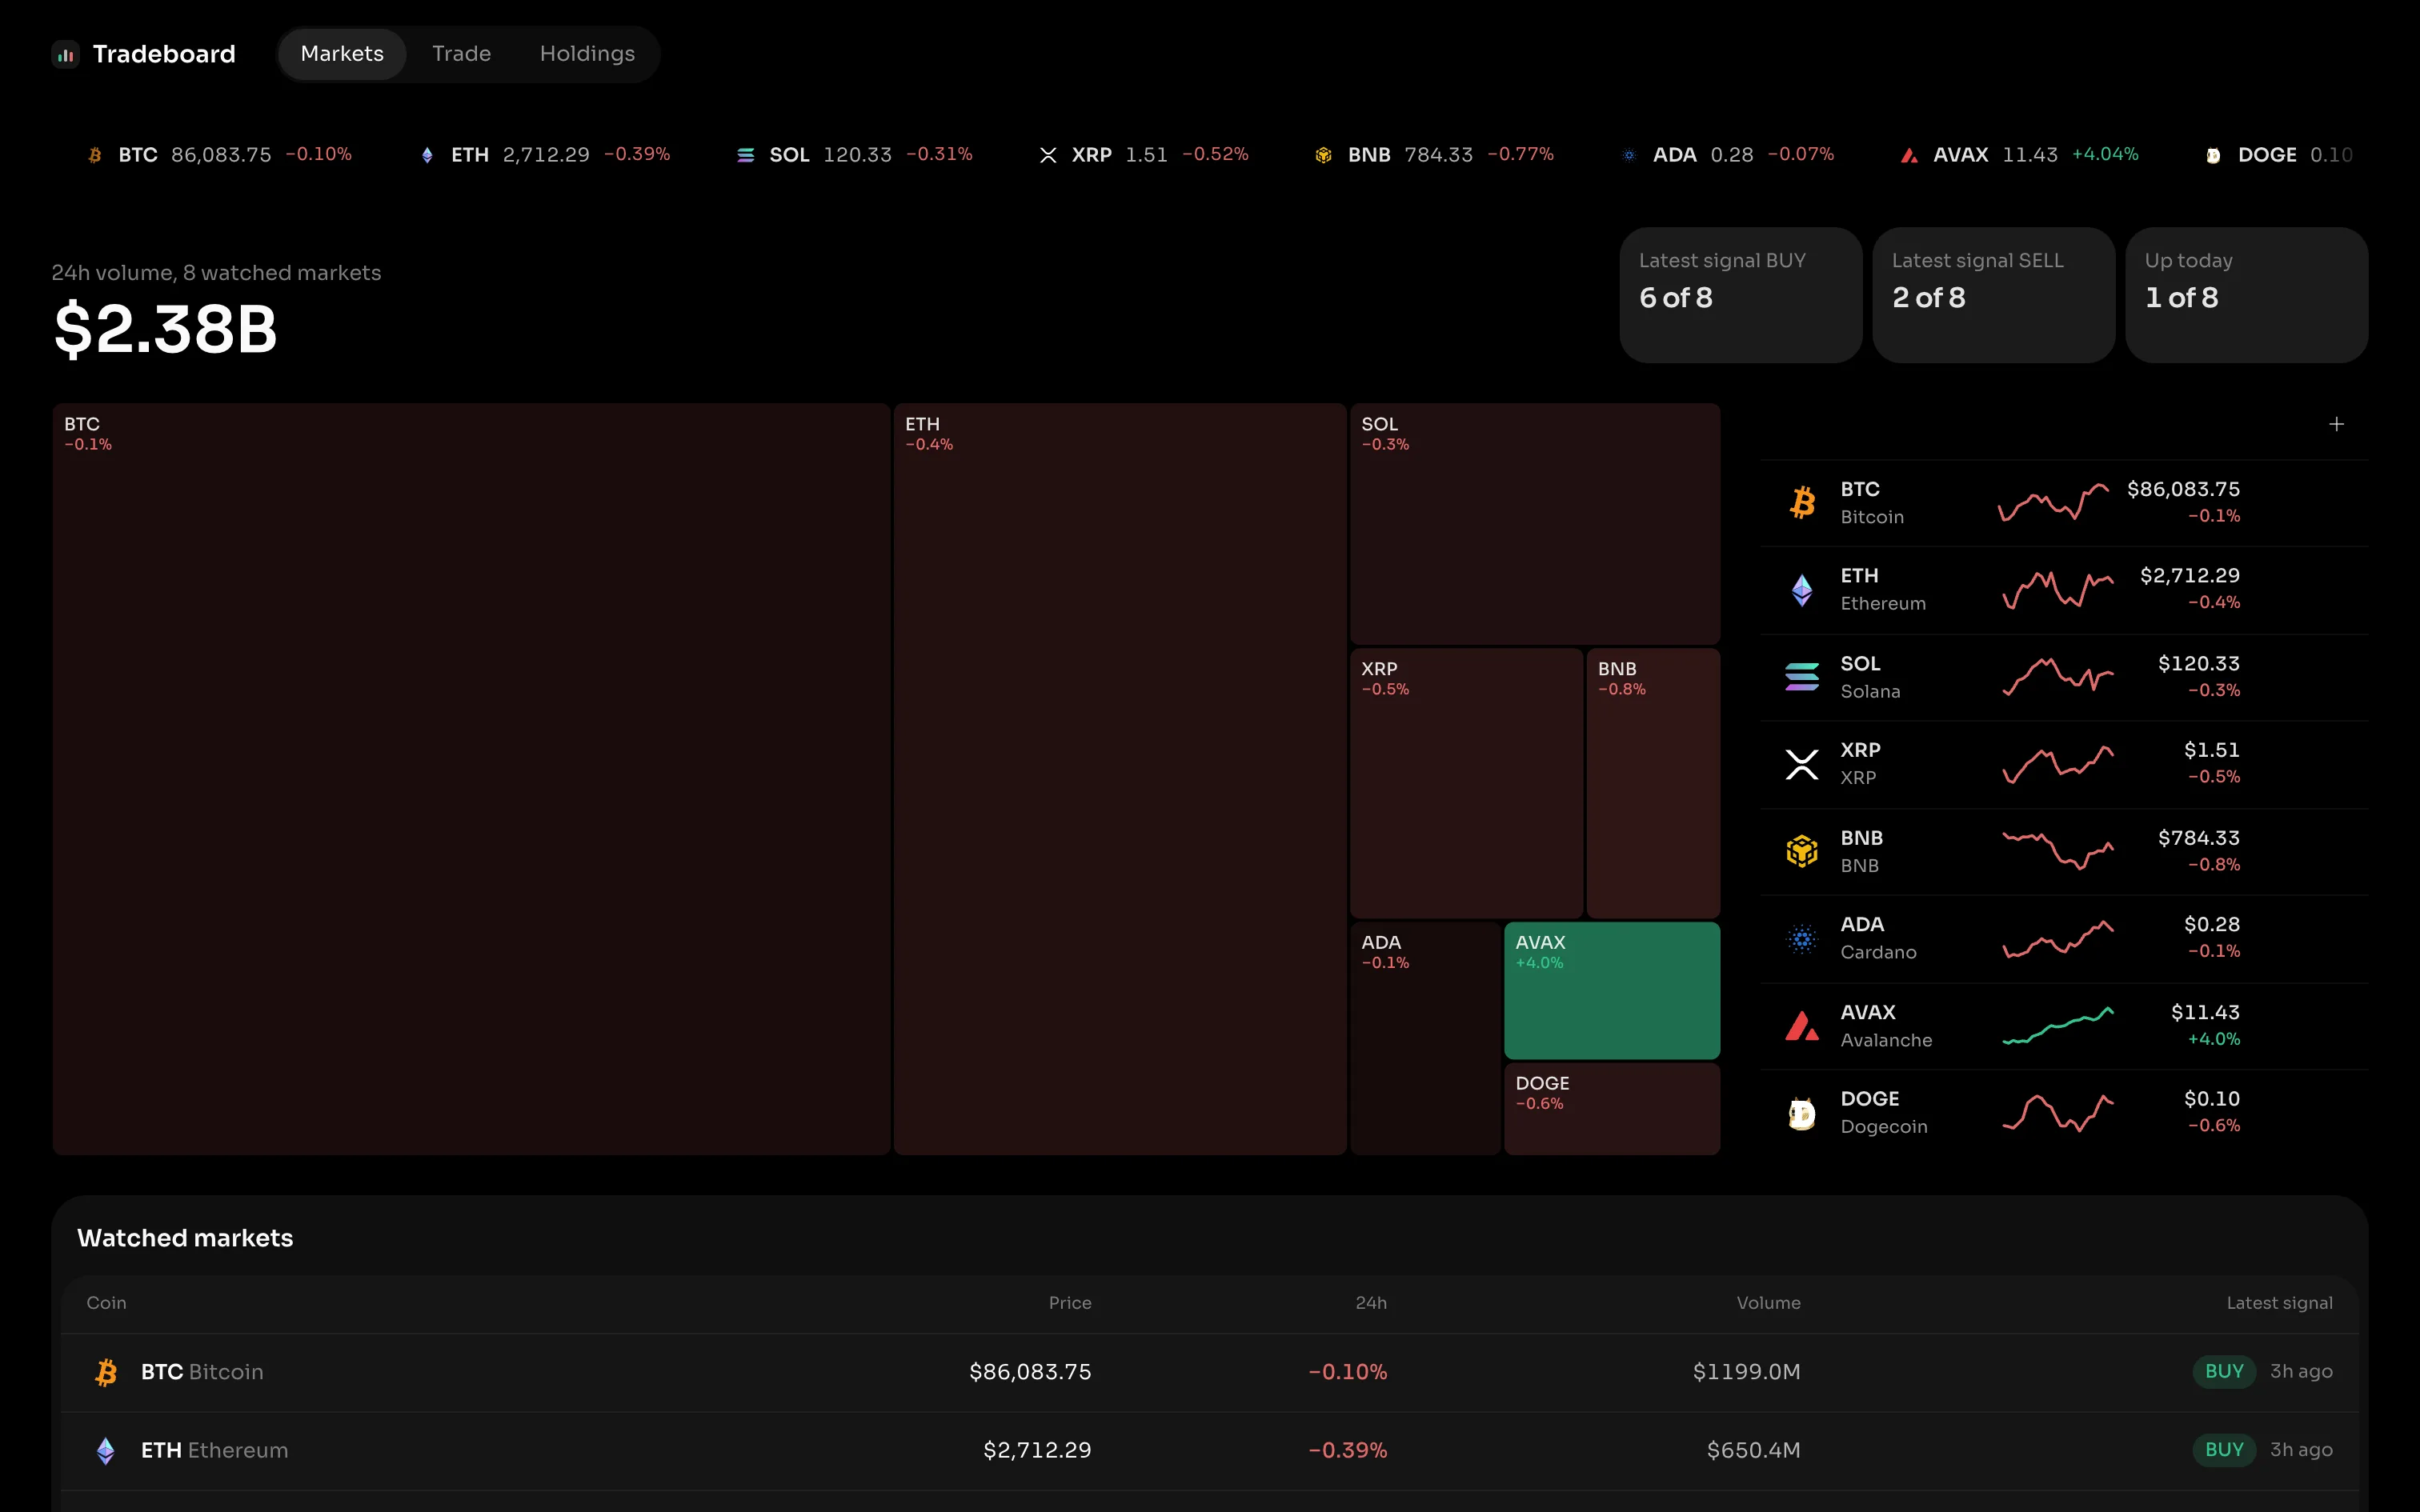
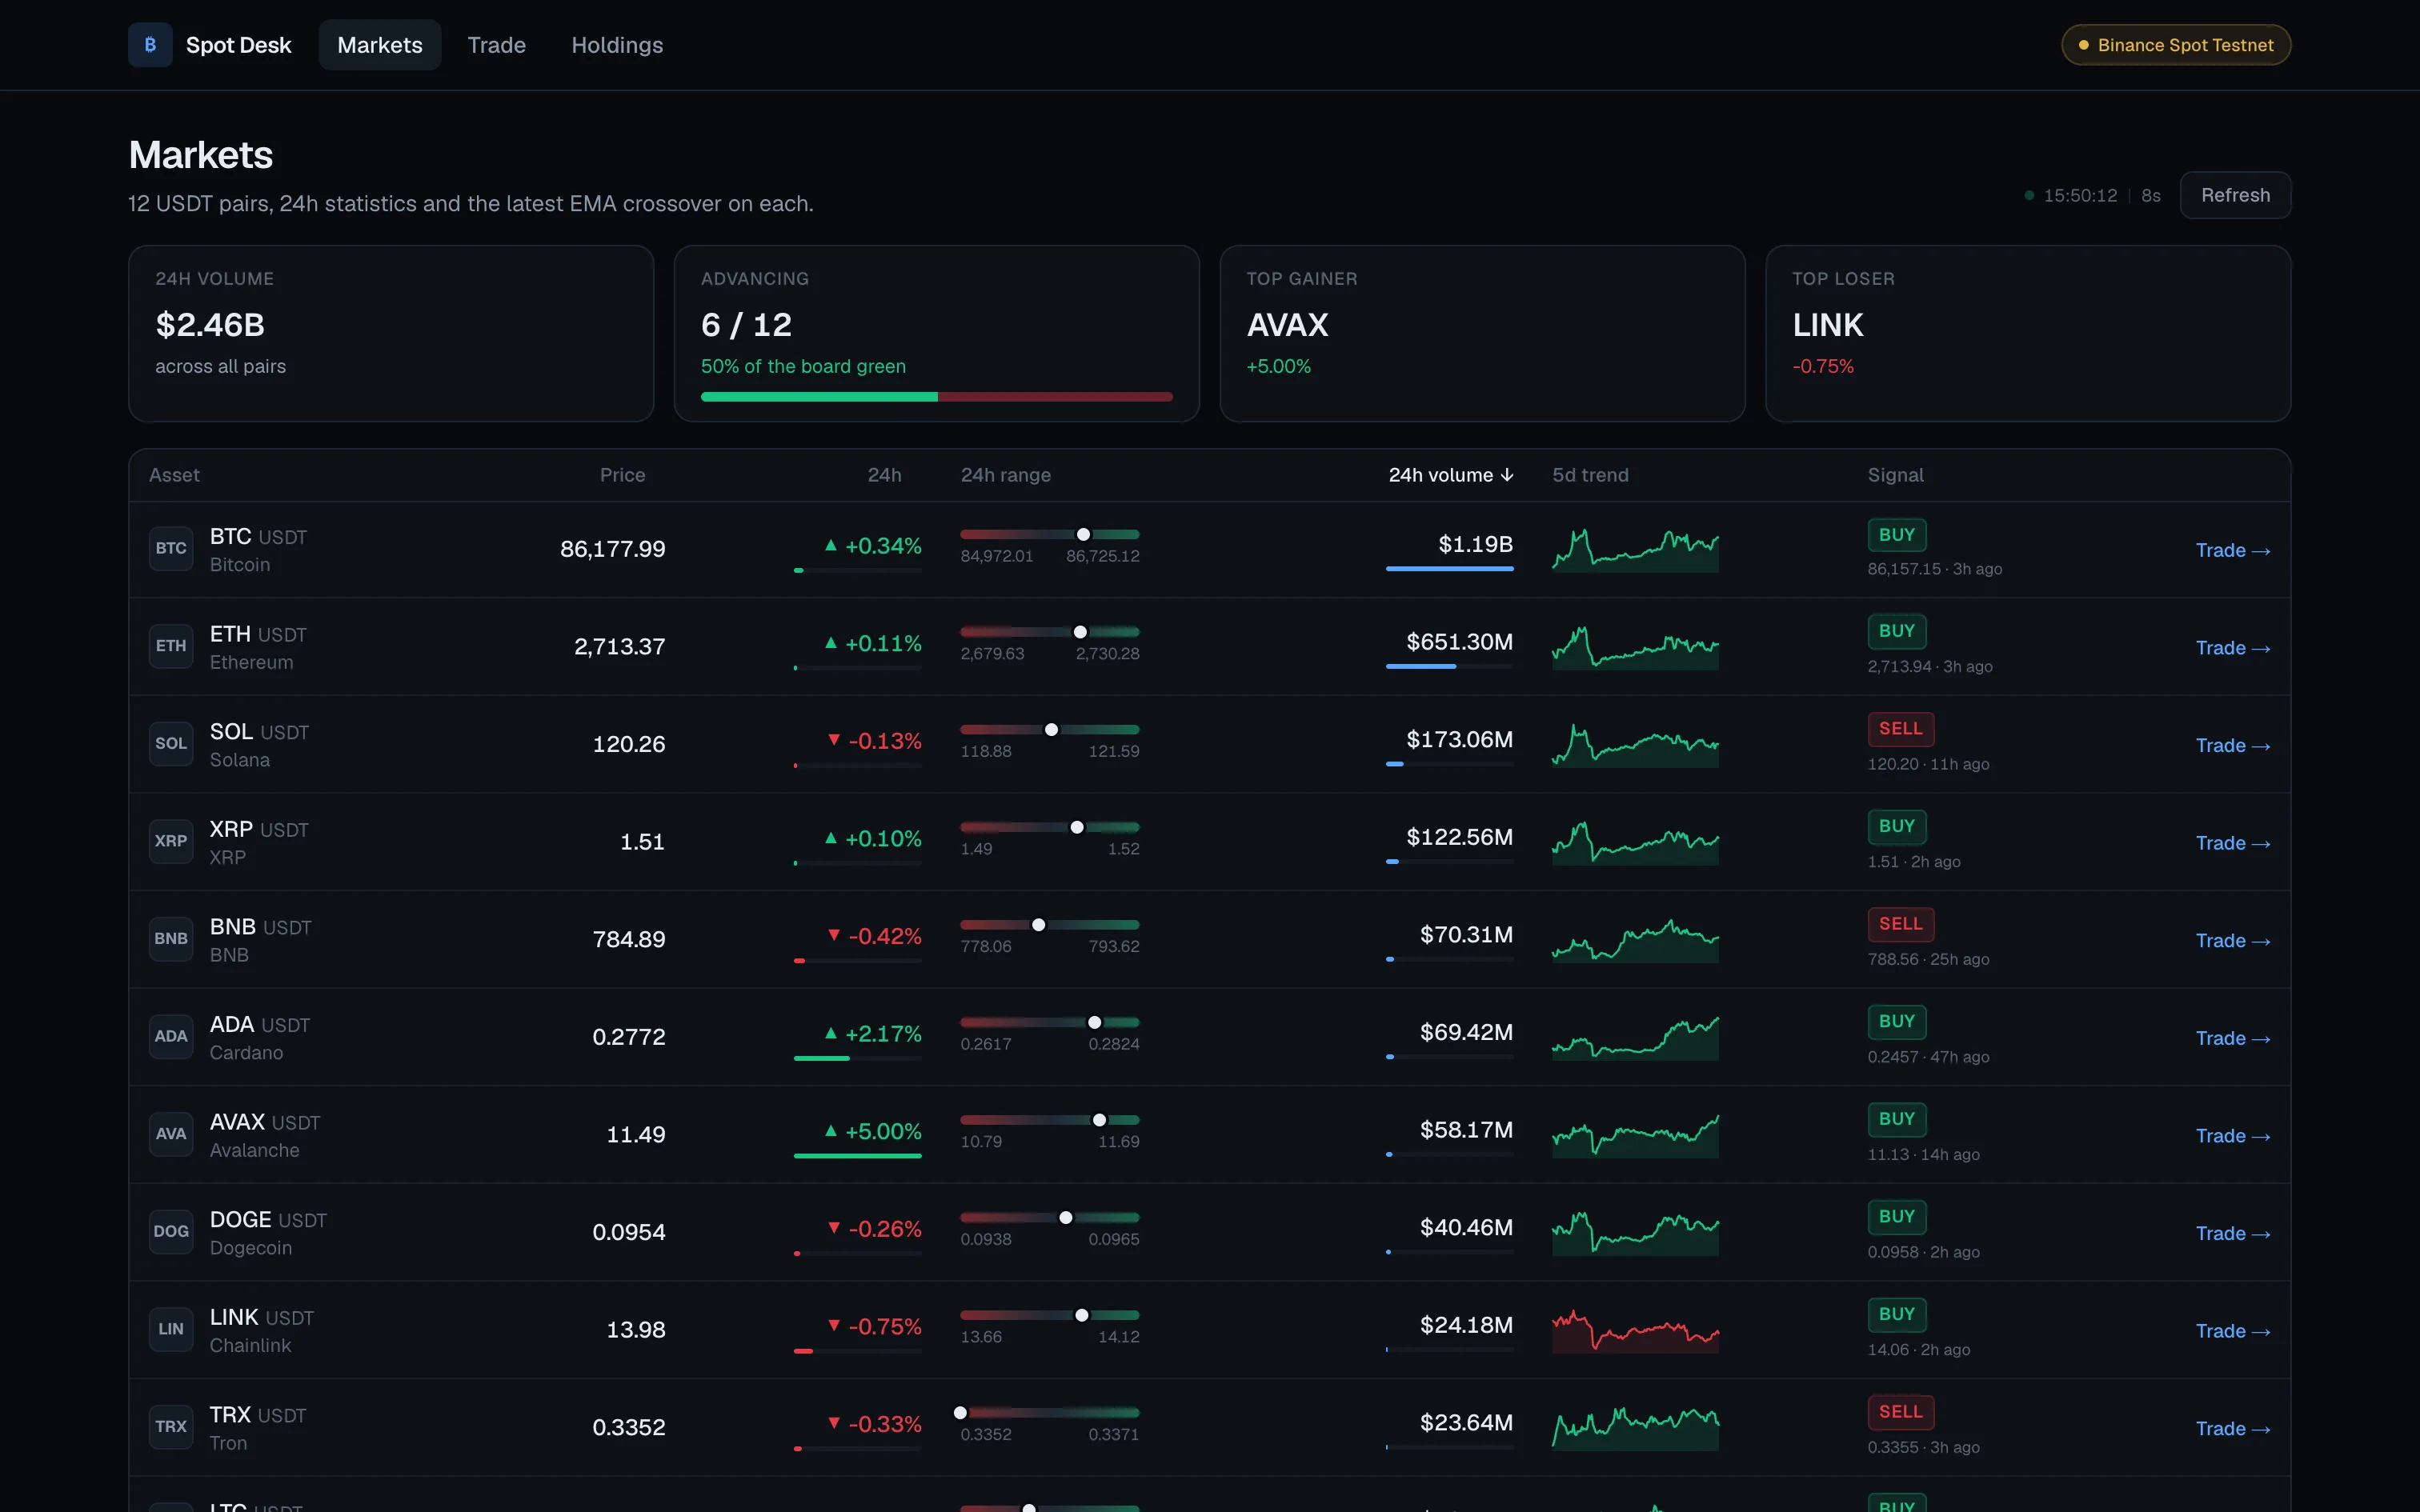
The prompt does the part a component library usually leaves to you: which component goes where, how wide it is and what data it gets.
Build it yourself
The starter repo is the data layer with no screens. Market data needs no key. For orders, get free testnet keys at testnet.binance.vision and put them in .env.local.
git clone https://github.com/savvasicevs/tradeboard-starter
cd tradeboard-starter && npm install
cp .env.example .env.local
Then open Claude Code in the folder, paste the prompt and run npm run dev.
Build Tradeboard: a dark, three-screen trading dashboard (Markets, Trade, Holdings) on the data already in this app. The data layer is done: `src/lib/binance.ts` (public Binance prices, candles, order book), `src/lib/signals.ts` (9/21 EMA crossover signals) and the Binance Spot Testnet routes in `src/app/api` (`/api/account`, `/api/trades`, `/api/history`, `/api/order`). Read them first. Use the ssych components below for every chart, table and control; write only the layout and the data mapping around them.

## 1. Setup

1. Add the ssych registry to `components.json`: `"registries": { "@ssych": "https://ssych.com/r/{name}.json" }`
2. Install, one command each: `npx shadcn@latest add @ssych/<name> --yes --overwrite` for stat-tile, ticker-tape, market-heatmap, watchlist-stack, segmented-control, candlestick, depth-chart, order-book, order-ticket, trade-journal-table, balance-header, graph-comparison, holdings-table. Then `npm i @web3icons/react`.
3. Read each installed file in `src/components/ui` for its props before using it. Every one takes `className`; pass `w-full max-w-none` (plus your own spacing) so it fills its grid cell.
4. Append to `src/app/globals.css`:

```css
.dark { color-scheme: dark; }
.dark {
  --chart-1: #489ffa;
  --chart-2: #4dbe95;
  --chart-3: #c27c58;
  --chart-4: #e9ec89;
  --chart-5: #c88fcf;
  --chart-amber: #e8b45a;
}
```

## 2. Shell

- Root layout: Sora from `next/font/google` as `--font-geist-sans`, `className="dark ..."` on `<html>`, `bg-black text-foreground` on `<body>`.
- Header and main share one column: `mx-auto w-full max-w-[1512px] px-8`; main adds `pb-16 pt-2`.
- Header, left aligned, `flex items-center gap-6 py-4`: a small mark and "Tradeboard" (15px semibold), then right beside it a pill nav with Markets `/`, Trade `/coin/BTCUSDT`, Holdings `/holdings`: track `rounded-full bg-foreground/[0.05] p-0.5`, each link `rounded-full px-3.5 py-1.5 text-[13px]`, active `bg-foreground/[0.09] text-foreground`, others `text-foreground/55`.
- Coin icons, `src/components/coin-icon.tsx`, passed to every component's `renderIcon`:

```tsx
"use client";
import { TokenIcon } from "@web3icons/react/dynamic";
export const coinIcon = (symbol: string, size: number) => (
  <span className="inline-grid shrink-0 place-items-center overflow-hidden rounded-full" style={{ width: size, height: size }}>
    <TokenIcon symbol={symbol.toLowerCase()} variant="branded" size={size} />
  </span>
);
```

- `Panel`, `src/components/panel.tsx`, the box every table sits in: outer `rounded-3xl bg-foreground/[0.06] p-1.5`; an optional title row `flex items-center justify-between px-2.5 pb-1.5 pt-1` (a string title is an h2 `py-1.5 text-[15px] font-semibold`); inner `overflow-hidden rounded-[18px] bg-foreground/[0.025]`, with `pt-3` when an `inset` prop is set. No borders on panels.
- Style rules: no borders or outlines on cards, fills only; sentence case, never uppercase labels; numbers `tabular-nums`; up `var(--chart-up)`, down `var(--chart-down)`; a BUY/SELL pill is `rounded-full px-2 py-0.5 text-[11.5px] font-medium` on a 16% `color-mix` of its colour.

## 3. Markets (`/`), client component

- Data: `getTickers()` sorted by `quoteVolume`, refreshed every 10 s; `latest(await getCandles(s))` per symbol for its last signal; `getCandles(s, "1h", 24)` closes per symbol for 24h sparklines.
- State `watched`: the top 8 symbols by volume to start. The list, the map, the figures and the table all show only watched coins.
- Top to bottom, `space-y-6`:
  1. `TickerTape` over all tickers, full width.
  2. A row `flex items-end justify-between`: left, "24h volume, N watched markets" (13px, /50) over the total watched volume as `$X.XXB` (40px semibold); right, `StatTile` with three items: latest signal BUY, latest signal SELL, up today, each as `n of N`.
  3. A grid `lg:grid-cols-[minmax(0,1fr)_380px] gap-6`: left `MarketHeatmap` sized by 24h volume in billions (`sizeLabel="24h volume"`, `formatSize` as `$X.XXB`), its `height` set to the measured height of the right column (ResizeObserver) so both read as one row; right `WatchlistStack` titled "Trending": `stocks` = watched coins, `candidates` = the rest, add and remove update `watched`, selecting a coin opens `/coin/<SYM>USDT`.
  4. `Panel` "Watched markets": a 5-column grid table `grid-cols-[1.5fr_1fr_0.7fr_1fr_1.3fr]` (Coin: 24px icon, then ticker and name on one line, the name at /45; Price with 2 decimals, 4 below $1; 24h, Volume in $M, Latest signal pill + how long ago), each row a link to its Trade screen, rows split by `border-t border-foreground/[0.05]`.

## 4. Trade (`/coin/[symbol]`), client component

- Data, every 5 s: `getTickers([symbol])`, `getDepth(symbol, 1000)`, `getCandles(symbol)` (1h, 200). Once: `/api/account` balances and `/api/trades` rows. `signals(candles)` for the signal list.
- Top to bottom, `space-y-5`:
  1. A row of coin chips for all `SYMBOLS` (icon + ticker, `rounded-full`, active one brighter), each a link.
  2. A grid `xl:grid-cols-[minmax(0,1fr)_300px_340px] items-start gap-5`:
     - Chart, book and ticket sit straight on the page: no Panel or card around any of them.
     - Chart column: a head row with the coin icon, name, `BASE/USDT`, today's change and a "Signal: BUY/SELL" pill, and on the right a `SegmentedControl` Price | Depth. Below it `Candlestick` (last 72 candles, volume as a multiple of their average, the signals as `markers`, `height={470}`) or `DepthChart` (`height={470}`).
     - `OrderBook`, 11 rows, `tick` 0.01 (0.0001 below $1), `priceDp` 2 (4 below $1), `sizeDp={4}`; pass the same tick to `DepthChart`.
     - `OrderTicket`, rendered only once the price is in, market by default, keyed on the symbol and both balances so it resets after a fill, `defaultAmount` 0.001 above $1,000, 0.1 above $10, else 10, its balances from `/api/account`; `onSubmit` POSTs `{ symbol, side: "BUY"|"SELL", usdt: total }` to `/api/order`, then shows the fill as a line below the ticket and reloads balances and trades.
  3. `Panel` with `inset`, its title a `SegmentedControl` Signals | Your trades (`className="dark:border-transparent dark:bg-foreground/[0.06]"`): Signals shows `TradeJournalTable` with each signal as a $1,000 trade held to the next opposite signal (BUY = long, SELL = short, the newest still open); Your trades shows the `/api/trades` rows for this coin, or a one-line empty state.

## 5. Holdings (`/holdings`), client component

- Data: `/api/account` balances (already sorted by value), `/api/history` (its `24h` window), `/api/trades`, and `getCandles(s, "1d", 365)` for each of `SYMBOLS`.
- Top to bottom, `space-y-6`:
  1. A row: `BalanceHeader` with the total value and its 24h move (total now minus the 24h window's first point); on the right "Binance Spot Testnet · N assets" (13px, /45).
  2. `GraphComparison` "Your coins over the year": one series per held coin that has candles (daily closes), periods 1M/3M/6M/1Y as 31/92/183/365 closes, the 4 largest selected, `max={5}`, `height={300}`.
  3. `Panel` with `inset`, its title a `SegmentedControl` Holdings | Trades: `HoldingsTable` "Largest holdings" (the 10 largest: value, price, 24h change, share of the total) or `TradeJournalTable` with all testnet trades.

The testnet gives every account a little of hundreds of coins: always show the largest few, never the whole list. When done, run `npm run build` and fix anything it reports.
tradeboard-starterThe data layer and PROMPT.md, on GitHub.github.com/savvasicevs/tradeboard-starterThe components
Every component in the prompt is free. Each one installs with one shadcn command and the files land in your repo, so you can change anything.
 Browse componentsCharts, tables and tickets for dense trading and AI screens.ssych.com/library/components